2.5 Metrics (optional)
Optional Section
The following content is optional. If you have time, feel free to proceed.
Metrics with Prometheus and Grafana
The involved components for our metrics to be working are:
- MicroProfile Metrics: Expose the application metrics as a RESTful Endpoint
- Prometheus: Scrape the exposed metrics periodically
- Grafana: Visualize the scraped metrics
Dependencies
Our application includes the following dependency in the pom.xml.
| GroupId | ArtifactId | Description | Detailed information |
|---|---|---|---|
io.quarkus | quarkus-smallrye-metrics | Exposes various metrics and statistics about the application | MicroProfile Metrics |
Including this dependency is enough for our application to expose the metrics at /metrics
Metric Details
The exposed metrics are using the OpenMetrics Format format. Metrics can be put in three different scopes.
Scopes
- base: metrics that all MicroProfile vendors have to provide. e.g. JVM metrics
- vendor: vendor specific metrics
- application: application-specific metrics
Source: github.com/eclipse/microprofile-metrics
More Details: MicroProfile Metrics - Scope
We will only generate metrics for the scope application.
There are various type of metrics available. The most used types are:
- Counters: Counters are a metric that is used to keep an incremental or a decremental count.
- Gauges: represent metrics that are sampled to obtain their value.
- Meters: Meters are used to track throughput.
- Timers: Timers are used to aggregate timing duration, in nanoseconds, and provide duration and throughput statistics.
MicroProfile Metrics provides these types as annotations @Counted, @Timed, @Metered and @Gauge.
Task 2.5.1 - Inspecting metrics
Start the environment (if not already running) and point your browser to http://localhost:8080/metrics
- What do you get?
- Can you identify the different scopes?
- Can you locate some application specific metrics?
Task Hint
You will get all metrics in the OpenMetrics TEXT Format. Each metric is on a new line.
The different scopes can be seen by having a look at the first part of a metric (e.g. vendor_).
Defining metrics from code
The following snipped is part of the RESTful API endpoint ShopOrderResource.
| |
full source ShopOrderResource.java
This code defines the following metrics:
| |
Task 2.5.2 - Interpret metrics
Try to interpret the metrics from the listing above
- How many orders have been requested?
- How long does the creation of an order take?
- Were the requests made recently or some time ago?
- Were there peaks or were the requests evenly distributed over time?
Task Hint
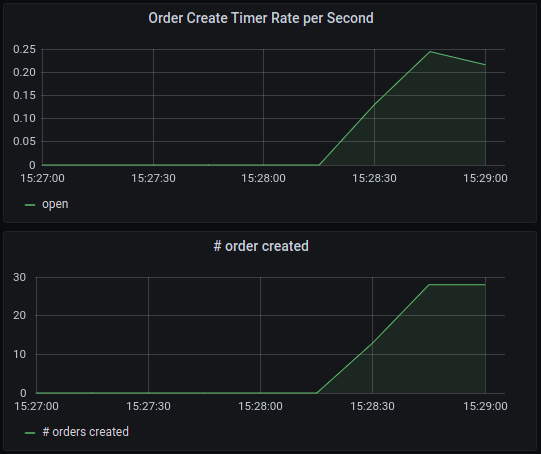
- A total of 28 orders created
- The count on
rate_per_second,one_min_rate_per_secondare higher thanfifteen_min_rate_per_secondwhich indicates that most requests are seconds/minutes ago. - There seem to be peaks as the rates for second, minute, five and fifteen are not evenly distributed.
The graph may look like this
Task 2.5.3 - Inspect grafana dashboards
Head over to the Grafana UI at http://localhost:3001
. Login with admin/admin and inspect the two available dashboards.
- SmallRye MicroProfile Metrics: Generated Dashboard containing base and vendor metrics.
- Monolith Dashboard: Custom Dashboard containing some basic metrics from the application.
Try to change an existing visualization
- Open the Monolith Dashboard
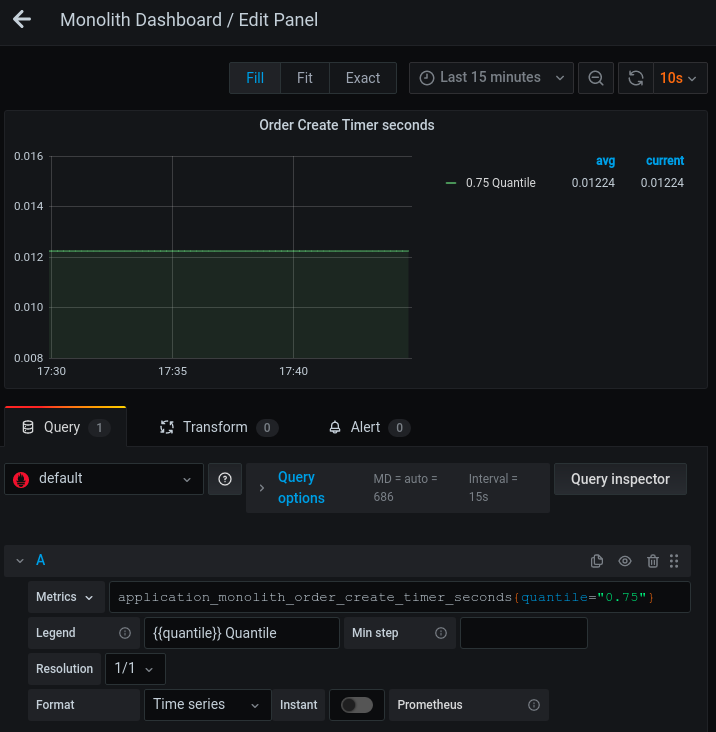
- Edit “Order Create Timer seconds” by clicking the title and selecting edit
- This graph contains multiple quantiles in the same graph. display only the 0.75 quantile.
- Apply a filter to the metric by adding
{quantile="0.75"}to the metrics query. This applies a filter to a tag named quantile with value0.75
The modified query is using the Prometheus Query Language (PromQL). Check the Querying Prometheus page for more details.
Task Hint
Prometheus scraping
We know how our application exposes metrics. We have also seen dashboards with simple visualizations.
Now have a look at the Prometheus configuration docker/config/prometheus/prometheus.yaml to see how the
scraping of these metrics is configured.
| |
This defines that Prometheus scrapes our application at port 8080. Note that the metrics_path is /metrics per
default. Prometheus will therefore query http://application:8080/metrics every 15 seconds to get new metrics.
For more information about the Prometheus configuration head over to the Prometheus configuration site.